Happi Pi Day
1. Happi Pi Day
Fun Fact: Pi seconds is roughly a nanocentury! (This can be a strangely useful thing to know in some circumstances).
2. Putting the Pi in Pin Probabilities…
Further Fun Fact: You can approximate Pi (π) by throwing a bunch of pins over some lines on the ground, and then counting how many of the pins end up overlapping with the lines!
“Pray, Pat, Proceed to Pronounce Plainly ‘pon!”
If, perchance, you propose to propel a pin onto a prepared planar surface, previously peppered with a particular pattern of parallel lines (pitched a pin-length apart), the probability ‘p’ of a particular pin projecting to penetrate a parallel is precisely 2 per π (or 64 percent, ‘proximately).
As a consequence of this, π itself can be approximated as 2 divided by the measured “hit rate” of several such pin-throwing trials.
Why Does This Work?
It works because the centre of each pin will always land somewhere within half-a-unit’s separation of one of our parallel lines (our basic “unit” is a pin’s length), with some random angle of orientation. The pin’s “sideways reach” towards the nearest parallel line will be cos(angle)/2 units, and the likelihood of this reach being greater than the “separation” defines the probability of an overlap…
A bit of calculation shows that the area under the “reach curve” for the pins, taken across the range of relevant angles, is simply 1 (taking the integral of cos(angle)/2 across the range -π/2 to +π/2).
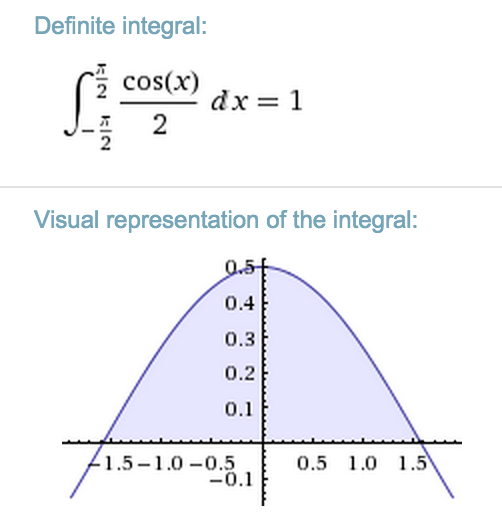
Similarly, the “separation curve” is merely a rectangle of width π (covering the relevant range of angles) and height 1/2 (covering the range of potential nearest-separation distances) — so its area is obviously π/2.
From this we can infer that our probability of overlap is the “reach area” divided by the “separation area”, which is 1/(π/2), simplifying to 2/π, as previously proclaimed (!)
Show Me!
Anyway, I finally decided to try actually running this experiment — but, because I am lazy, I got a computer to do most of the grunt-work for me…
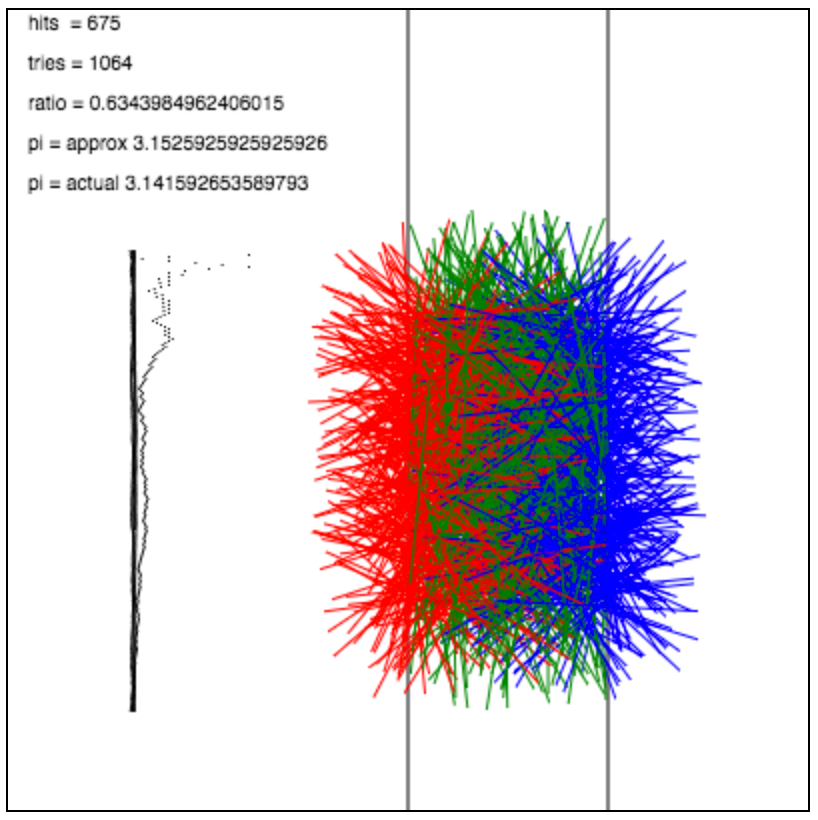
Click on the box below to see it running in your browser (hopefully)… the “pins” are thrown onto the screen perpetually, and are coloured red / green / blue depending on whether they hit the left-line / no-line / right-line.
(There is also a little vertical “tracer graph” which shows the history of the computed π-approximation over time):
You should see something a bit like this:
3. Now I Need A Drink
…alcoholic of course, after the heavy lectures involving cosines!
(The previous passage contains some secret π. As does the following):